Pages

Wednesday, August 29, 2012

2012 Esri User Conference impressions from the Flex development team


The Esri User Conference in San Diego, CA is always a great opportunity to learn about new Esri technology trends, reconnect with your colleagues, and meet some new folks in the community. This year was no different and we would like to summarize some of the Flex-technology related news and announcements from this year’s conference.

Open-sourcing of Flex SDK

Last November, Adobe announced the Flex SDK would become a community-driven open source project.  This summer the first open-source  Flex SDK version was released by the Apache Software Foundation project, and recently Adobe announced the beta release of the next Flash Builder.

Esri and Open Source Software: More Please


A few weeks ago GeoIQ joined Esri and, augmented by a few other Esri employees, we formed the Esri R&D Center, Washington DC, a.k.a the DC Dev Center. We immediately launched into action and are having fun brainstorming with our colleagues about what sort of technology and tools to explore. Transitioning a whole company at once was a new experience, and we’ve outlined some of our initial plans. Part of our transition involves working closely with our Esri co-workers to square up some goals for the future in terms of what makes the most sense for Esri as a whole and for the geo-developer community in particular. The DC Dev Center crew is a somewhat outspoken bunch of developers who are passionate and devoted to their craft and from early on it became clear where our experiences and passions could make a quick and significant impact.
At GeoIQ, we were heavy users of open source software and contributed code back to the community when we could. However, we feel that we could have been better about contributing code back to the community and developing more in the open. This is one of the areas where we as developers, evangelists, and geospatial uber-geeks feel that we can make a strong impact — improving Esri’s participation in and contributions to open source. Esri has always hosted open code and samples in a variety of ways, but more can be done. Focus and motivation needs to be improved, and Esri is now making it a priority to improve its open source participation.
More of Esri’s code should and will be open sourced in the coming days, weeks, months, and years. Patience is needed, of course, but we’re on our way. Here’s the basic plan: make it easy for Esri employees to write and share code in an open space and identify what products can and should be open sourced. To start, this means giving developers access to the appropriate tools, resources and space they need to collaborate with each other. This really just means Esri is beginning to leverage Github.
We will centralize Esri’s open code as much as possible, but again this will take some time. We are encouraging the sharing of ideas, experiments, and new code all to be developed openly on Github. We want Esri developers to have faces, be active on Github, and work more closely with those outside the company. We will embrace open source development as much as we can. You’ll see more code from Esri on Github. You’ll see more collaboration with other software projects. You’ll see Esri forking code and issuing pull requests on your repos – we are excited to be launching these new activities.
Developers who want to share ideas and code with us are welcome and encouraged to issue pull requests and file bugs and features on the repos. We’ll be gauging our success in this effort by the level of collaboration between internal developers and others who are willing to collaborate. Again, the Esri development team is excited to see how this plays out over the next few months. We know perceptions die-hard. This initiative is about a cultural change that has internal buy-in at all levels. Esri wants to push the limits of our industry and lead through openness and sharing where other companies have failed to see the benefit. We want to see progress and innovation in geospatial technology through collaboration with developers who share different perspectives and insights.
We’ve got the ball rolling already with several repositories up and running on Github. Esri’s presence in Github centers around two separate accounts: http://github.com/esri and http://github.com/arcgis. The “esri” account will house (host?) code that is meant to be more freestanding and generic. Code that a has broad reach to very more non-GIS community like visualization examples, solutions and various other scripts will all live there. The “arcgis” account will house open source code related directly to the “ArcGIS Platform” and have repositories for things like ArcGIS Online templates and ArcGIS Desktop extensions. The structure of all the code and repos will grow and evolve as Esri places more code on Github.
More open source code and more collaboration with others is a good move by Esri and only good things will come from it. You’ll be surprised by some of the code and projects that’ll be open sourced soon. As usual, hearing any comments, suggestions or opinions would be great in helping Esri shape the future of its open source effort.

Tuesday, August 28, 2012

Applying media queries to your ArcGIS API for JavaScript applications


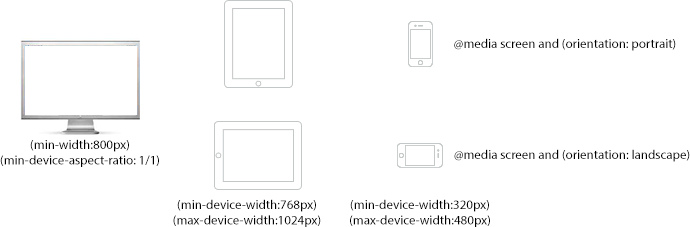
Smartphone and tablet usage is quickly usurping the desktop.  Targeting the dizzying array of browsers, screen sizes and devices in a market experiencing hardware fragmentation is one of the challenges developers encounter.  Although responsive web design does not offer a panacea for all scenarios, designing your web mapping applications to be mobile-friendly using this technique can provide an improved experience to your end-users.
CSS3 media queries enable developers to selectively style their pages based on properties (device width or height, resolution, orientation) of the browser where the page is being rendered.  For instance, you can now choose to style a page differently for a small screen such as smartphone versus a slightly larger screen such as a tablet, or the desktop.
Using the Legend Widget sample as a starting point, I will show you how I modified an ArcGIS API for JavaScript application to support tablet (768 x 1024px) and smartphone devices (320 x 480px).

Friday, July 20, 2012

Esri Maps for Office 1.0 release now available!


We’re pleased to announce the release of Esri Maps for Office v1.0 powered by ArcGIS Online.
Esri Maps for Office is a powerful add-in for Microsoft Office that brings the capabilities of Esri’s ArcGIS Online mapping platform to Microsoft Excel and Microsoft PowerPoint users.
With Esri Maps for Office, you can easily create interactive maps of your organization’s data, enabling you to see patterns that graphs and charts cannot reveal. Any of the interactive maps you create can be embedded in PowerPoint, so you can make your presentations even more impactful. And by leveraging ArcGIS Online, you can quickly and securely share your interactive maps in web pages, blogs, and mobile apps as well as with ArcGIS users.
Within Excel, it takes just a few seconds to create an interactive map of your data. You can map your data regionally, such as by postal code, create point maps that show individual locations, generate heat maps to show where there are concentrations of points, and more. Esri Maps for Office gives you broad control over styling your mapped data, enabling you to make the important facts stand out.
In PowerPoint, maps can be inserted as static images or as “live” maps that you can interact with during your presentations. Live maps allow for zooming in and out, moving around the map, and displaying “pop-ups” with additional information about map features when you hover the mouse over them.
Several updates have been made from Beta to v1.0 to improve the overall performance and experience, including:
  • Improved user experience for adding Excel data
  • Export your point data enriched with location information
  • Notification of errors when finding locations
To install Esri Maps for Office, visit the Esri Maps for Office page and click the Download link on the right under Quick Links. If you currently have the Public Beta version installed, you can install v1.0 simply by running the setup.
If you are traveling to the International User Conference in San Diego next week, please come by and see us at the Location Analytics Island in the Esri Showcase!
~Esri Maps for Office team

Wednesday, July 11, 2012

Using Yahoo! Pipes to create dynamic map layers


Yahoo! Pipes are a handy way to aggregate web feeds and other information from various sources. One way to think of Pipes is as a way to create data/information mashups, just like we can create ArcGIS Online web maps by mashing up a variety of map layers. An interesting aspect of Pipes is that we can leverage them in the context of our ArcGIS Online web maps, and use them to create dynamic layers using URL-located KML or CSV files as mappable information sources.

Monday, July 9, 2012

Add Pinterest photos to ArcGIS Online web maps


Pinterest is a social photo sharing site that lets you create and manage “boards” of photos, usually organized around some theme. Pinterest users can browse other pinboards and ‘re-pin’ images in their own collections, or ‘like’ photos. Pinterest’s mission is to “connect everyone in the world through the things they find interesting.”

Downloadable tools for ArcGIS Server administration


With the release of version 10.1, automating administrative tasks on ArcGIS Server got a whole lot easier. The new ArcGIS Server Administrator API allows you to perform the same administrative tasks you can do in ArcGIS Desktop or ArcGIS Server Manager. Because it’s a REST-ful API, you can programmatically build up URLs to make calls to the server to perform tasks.
Using this API, I’ve published a sample that puts server admin tasks into an ArcGIS toolbox and ModelBuilder. The ArcGIS Server Administration Toolkit (download), written with Python, provides a variety of tools that you can use to administer the server. For example, there are tools for starting and stopping services, modifying log settings, registering server object extensions (SOEs), and publishing services from service definition files. You can chain these tools together in ModelBuilder to complete a workflow, or you can run them in a one-off fashion directly from the toolbox.