Pages

Wednesday, June 6, 2012

Experimenting with HTML5 and the ArcGIS API for JavaScript


During our JavaScript technical sessions, we showed several
applications that take advantage of HTML5 functionality like local storage,
native drag and drop, file access, offline storage and more. These
samples are still in an experimental stage and may not work on all browsers,
but we wanted to share them with you so you can start planning and prototyping
interesting applications that combine HTML5, CSS3 and the ArcGIS API for
JavaScript.
Experimental folder in JavaScript samplesTo view the samples, visit the ArcGIS API for JavaScript Resource
Center Samples
Overview
 page and expand the Experimental folder. To determine the level of support in various browsers, visit caniuse.com,
a web site with compatibility tables for HTML5 and CSS3 support.
For those of you who missed the conference, the
technical sessions were recorded and the videos will be available in a few
weeks on proceedings.esri.com.

ArcGIS API for JavaScript Tips-n-Tricks: Parsing GeoRSS with jQuery


There are quite a few reasons why GeoRSS feeds can be tricky to parse. The reasons include confusing child-parent tag relationships, and some parsers simply don’t work with namespaces (e.g. ) depending on which browser you are using. This is where jQuery comes in very handy, especially if you want your app to function well across the major browsers. The pattern that you can use looks like this:


//Look for the tag  
$(data).find(“[nodeName='geo:lat']“).text()

Feel free to click here to see a live example and view the source code. Or just download the source and try it out on your machine.

References:
http://api.jquery.com/find/ 
http://api.jquery.com/jQuery.ajax/ 
http://docs.jquery.com/Tutorials:How_to_Get_Anything_You_Want

ArcGIS on Smartphones & Data Collection Playground


Your iPhone, Windows Phone, iPad or iPod Touch can become a powerful tool for field data collection. Using the ArcGIS application that is available from Apples’ App Store and the Windows Phone Marketplace, you can collect GIS features using the GPS receiver in your device or by sketching on the map, fill out intelligent attribute forms  and attach photos/videos to them. All edits are instantly synchronized with your enterprise geodatabase.
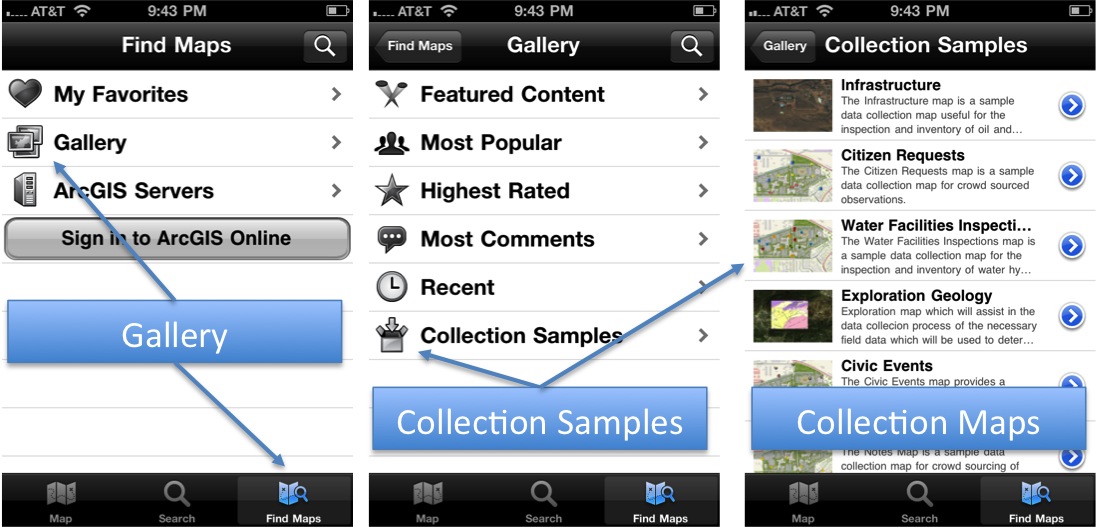
Getting started is as simple as using your smartphone. The Mobile team has hosted a number of data collection maps in a group called “Collection Samples” that is accessible directly on your phone and can be found inside of the Gallery. Here is how you can access the collection maps using your iPhone…
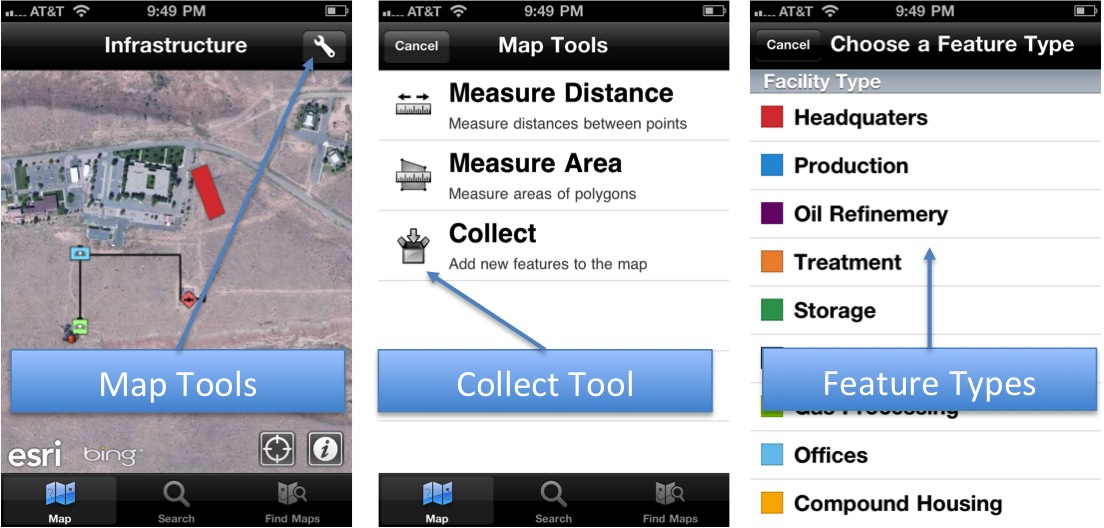
After tapping on one of the maps in the Collection Samples group (Infrastructure for example), you will find that the map itself contains additional functionality within the Map Tools called Collect. Tap on Collect to choose a Feature Type or Template from the editable map layers and then follow the additional steps to collect a new GIS feature.
These maps are available using ArcGIS Online and are publicly shared in a group called Esri Data Collection Playground for you to get started with. Feature layers provide templates for data collection inside of the ArcGIS application. Each of the collection sample maps available within the smartphone app have an associated Map Package that you can download to your server as well. To find the map package, look at the details of the map inside of ArcGIS Online. Looking at the details of the Infrastructure Map you will find a link to the Infrastructure Map Package. Opening the map package you can then host your own Feature Service and then either use ArcGIS Online or your own on-premise server to host maps for use on your smartphone device.
We would like to see you start leveraging smartphones for data collection today. Please try the Collection Sample maps and let us know what you think. Send your feedback to arcgis4iphone@esri.com.
NOTE: The features you add to the maps hosted inside of the Esri Data Collection Playground are archived and then scrubbed nightly. Please do not expect features to be maintained. This is a playground and we are here to pick up after your edits…

If you are new to ArcGIS API for Flex Developers: Starter Project Template


If you are new to our ArcGIS API for Flex or new to Adobe Flex
and ActionScript development, we wanted to tell you about a starter project
template that lets you significantly speed up developing your first mapping
application. It’s actually a prototype that was built based on feedback from experienced
Flex developers who wanted to get a kick-start on their ArcGIS web maps. So, download
it and let us know what you think!
How does it work?
The template lets you use a single-line coding pattern, which will be familiar if
you have developed with Google Maps, Bing or MapQuest APIs. For example, you
can use wmap.center(34,-110,10,0)
to center the map, set zoom-level and map type (topo, streets or imagery). It also
includes other single-line methods for placing symbols (lines, shapes,
pushpins, etc) on the map, and converting addresses to lat/lon’s for mapping
purposes.
At the heart of the template is a toolkit that wraps the
ArcGIS API for Flex. This means you can add any ArcGIS API for Flex functionality
you want, as your needs grow beyond the starter template.  And, since the API is built upon native ActionScript
Classes
 you have access to all of those capabilities, too.
So how do I get
started?
 You will need Adobe’s FlashBuilder. Then download
the project
and import it: Import > Flash Builder
Project
. When that process is completed, you will have a fully
functionality, read-to-go project. In the ArcGISMapDemo.mxml file, simply
comment out the functionality you don’t need and then run it: Run > Run > ArcGISMapDemo.
Download the project here.

Geolocation HTML5 using ArcGIS API for JavaScript


With the recent release of Internet Explorer 9 (IE9), I decided to create and test a sample application using the geolocation API in all four major browsers (Safari 5, Firefox 4, Chrome 10, and IE9) using HTML5 and JavaScript. Although there was some support for geolocation functionality prior to HTML5, there was no standardization.
How does it work?
The geolocation API is published through a geolocation object, which is a child object of the navigator object. If the object exists, geolocation services are available. Sounds simple, huh? As a matter fact, here is how to quickly test for geolocation:

if (navigator.geolocation) {
navigator.geolocation.getCurrentPosition
}
else {
alert(“Geolocation not supported on your browser.”);
}
So what information is being sent when you visit an application with geolocation support? The browser will ask if you want to share your location; if the user allows the application to acquire your location, then the browser will send your computer’s IP address and a collection of information of your surrounding Wi-Fi access points to their default location service provider (e.g., Google Location Services, Microsoft Location Services). This information includes MAC address, SSID, age, (how long ago in milliseconds since the Wi-Fi node was detected), and signal strength of all the Wi-Fi access points around you.
The location service then checks this information against a database, finds the location of all the access points provided, and using triangulation, returns your location. If no Wi-Fi access points are in range, or your computer does not have Wi-Fi, it may only use your computer’s IP to get an approximate location. The accuracy of geolocation varies, and in some cases, it may not be able to provide a location at all. More importantly, you will see different results across browsers.
The first thing that came to my mind about these location services was how they know where all these access points are located. Do you remember those Google cars driving around collecting Street View data? Well that was one way. Another company collecting data is Skyhook, which also has drivers driving around collecting data. Another way data is collected is cross-referencing Wi-Fi data with mobile cell towers and GPS data available from smartphones.
Test Results
First of all, I used our ArcGIS API for JavaScript version 2.3, which is an early preview of our API and is only for testing purposes. The reason why I used this version is that it will support IE9, which was released in early March along with our 2.2 version. All of my tests were done with a hard connection; they were Wi-Fi enabled but not connected to a wireless network.
IE9
My first test was with IE9, which was pretty accurate. My office is a little more left to the edge of the building but this location works for me.
Firefox
My next test was with Firefox and still on the same row but slightly more to the right.

Chrome
Here is where it got interesting: using Chrome, it located me outside the building. Just a minute ago I used Firefox, which uses Google Location Servicesjust like Chrome. I expected them to be identical in my location.
Safari
Last but not least, I used Safari, and if I am not mistaken, I think they use a different location service than the others. As you can see my location is still fairly close but not as accurate as IE9 or Firefox.
I had some of my colleagues test as well, who are located a couple of offices down the hall and they didn’t yield the same results as I did. In the image below I used our topographic map to show the detail of our campus location along with a blue dot representing my location. The geolocation marker is approximately 0.6 miles away. Since they did not receive the exact location as me, I decided to have them try it while connected to a wireless network. Below you can see they had better results when connected to a wireless network.
Hard Connection
Wireless Connection
In conclusion we learned the following:
  • Geolocation API works in all four browsers that support HTML5.
  • Location requests with Wi-Fi data are more accurate that those based on just an IP address alone.
  • Result will vary across browsers, users, and I am sure where location data is scarce.
  • The location becomes cached, which will improve the location services.
Although I did not touch upon mobile devices in this post, I did try this code with an iPhone and an iPad, and they both located me in the parking area of our building. I also tried testing it on my Motorola Droid x running Android 2.2 and Windows Phone Samsung, but they don’t have an HTML5 browser. However, once they do have full support for HTML5, it will be nice to write in HTML5 and JavaScript for mobile applications that can deliver features based on location services, for example, a map that can center based on where you actually are and display relevant data based on your surroundings.
Here is a geolocation sample that you can test for yourself, and if you have accurate or inaccurate results or discover something we didn’t, please feel free to share.

Binding to a Domain’s Coded Values in a Geodatabase (Silverlight and WPF)


This post discusses how Silverlight and WPF developers can utilize coded values for a domain defined on attribute fields in geodatabase for display at runtime (e.g. in MapTips, DataGrids, etc.).  Information about a feature layer can be used to discover coded values established via a domain applied to a field.  While feature attributes contain actual data values, coded values are often used to more effectively describe and present attribute information. For example, actual data values of 1, 2, and 3 may represent New, Open, and Closed.  A domain can be used to establish more descriptive values (New, Open, Closed) for codes (1.2,3) which changing the underlying data structure.  In the ArcGIS APIs for Silverlight and WPF, controls such as the FeatureDataGrid and the FeatureDataForm convert actual data values into coded values for you at runtime.  The APIs also provide developers with a couple of utility classes to convert actual values to coded values for use in other controls or workflows. 
The example below illustrates how to utilize coded values for a field in a feature layer using the CodedValueSources and CodedValueDomainConverter classes included in the ArcGIS APIs Toolkit library (ESRI.ArcGIS.Client.Toolkit.dll).  The coded values are displayed in map tips enabled on a feature layer. In order to get started, first add references to these classes in XAML as resources: 


The CodedValueSources instance represents a list of codes and values (descriptions) which can be populated upon feature layer initialization.
public partial class MainPage : UserControl
{
    CodedValueSources codedValueSourcesStatusField;

    public MainPage()
    {
        InitializeComponent();

        codedValueSourcesStatusField = LayoutRoot.Resources["codedValueSourcesStatusField"] as CodedValueSources;
    }

    private void FeatureLayer_Initialized(object sender, EventArgs e)
    {
        FeatureLayer flayer = sender as FeatureLayer;
        foreach (Field field in flayer.LayerInfo.Fields)
        {
            if (field.Name == "status")
            {
                CodedValueDomain codedValueDomain = field.Domain as CodedValueDomain;

                foreach (KeyValuePair codeVal in
                    codedValueDomain.CodedValues)
                    codedValueSourcesStatusField.Add(new CodedValueSource()
                    {
                        Code = codeVal.Key,
                        Name = codeVal.Value == null ? "" : codeVal.Value
                    });
                break;
            }
        }
    }
}
And finally, establish a binding to the attribute field on which a domain’s coded values should be used. The CodedValueDomainConverter will convert actual data values to coded values present in the CodedValueSources instance. 


A server object extension for performing dynamic segmentation


This post explains how I extended an ArcGIS Server map service to calculate the location of mile markers along a user-submitted polyline. This type of calculation of measurements along a line is called dynamic segmentation.
You can try it out in this app by drawing a polyline. The mile markers will appear on the line when you complete your sketch. You can alternatively choose to place kilometer markers.
Example web app for placing distance markers along a line 
In order to get my server to perform dynamic segmentation, I had to write a server object extension (SOE). This post explains what an SOE is, and how I went about designing this particular extension. If you like, you can download the source code and follow along.

What is an SOE, and why is one useful for this particular problem?

ArcGIS Server map services have a list of methods that they can perform, such as drawing a map, querying geographic features, or returning a list of layers. These methods cover the most common things that someone might do with a map.
Sometimes you may need your service to do something that’s not available with one of these out of the box methods. SOEs allow you to extend the map service with methods that use ArcObjects, fine-grained programming components that expose ArcGIS functionality. This really opens up the realm of things you can do with a service, since advanced ArcGIS functions like dynamic segmentation can be achieved through ArcObjects.
ArcObjects has an extensive object model that can be daunting to beginning programmers. If you’re worried about writing ArcObjects, check whether you can put your workflow into a model in ModelBuilder and publish a geoprocessing service. This is sometimes an easy alternative to building an SOE. In my situation, I could not find an easy way in ModelBuilder to take a single input polyline, assign m-values to it, and locate the mile markers. I had a good case for an SOE.

Designing the REST schema

One nice thing about SOEs is that they can be exposed through REST web services, allowing them to be easily used by the ArcGIS web APIs for JavaScript, Flex, and Silverlight. The ArcObjects SDK contains templates (Visual Studio) or wizards (Eclipse) to help you get started writing a REST web service. I planned to write my SOE with C# in Visual Studio, so I started with a template. The first thing I needed to do was build the REST schema for the web service.
A REST web service SOE exposes both resources and operations. Resources are items of information that can be returned by the SOE. Operations are things that the SOE can do. When you write a REST SOE, you need to determine which resources and operations you are going to expose. The REST SOE template has some example ones stubbed out for you.
In my case, I kept it real simple. I had one resource (the required root resource) which did not return any information beyond the name of the SOE, and one operation which located the mile markers. I called this operation LocateMarkers. I also had to define the parameters that LocateMarkers would take, which were a polyline graphic and a segment length (allowing me to find kilometer markers, too).

Writing the resource and operation handlers

Each resource and operation in your SOE must have a handler function. A typical operation handler function for a REST SOE does the following things:
  • Deserializes the web service request, which comes in as JSON. Going from JSON to ArcObjects types such as IPolyline can be tricky, so an SOESupport library is referenced in the template that has some deserialization and conversion classes for you.
  • Calls into your ArcObjects code to perform whatever GIS functions you need.
  • Serializes your results into JSON for the web service to send back as a response. Again, you can use the conversion and serialization classes in SOESupport to help you with this.
If you want to watch a more detailed explanation of this process with an example, see the workshop Extending ArcGIS Server Services using .NETrecorded from the 2011 Esri Developer Summit.
I followed these steps for my LocateMarkers operation handler. I began by deserializing the input polyline and segment length. I converted the polyline to IPolyline, assigned m-values to it, and added it to an in-memory feature class I had created. At that point, I was able to use methods in the ArcObjects Location library to find the marker locations given the input segment length. Finally, I had to serialize those locations into JSON so that they could be sent back as a web service response.
All of the above wound up taking a fair amount of code. I found that the ArcObjects Location library was well-documented when it comes to locating points with dynamic segmentation. Other things took longer to figure out, such as how to assign m-values to a single polyline. Thanks to the many generations of Esri developer documentation archived online, I was able to find answers to get past each hurdle. You might have a similar experience when developing your SOE.

Using the SOE in a web app

The most exciting thing about SOEs is that they allow your web applications to tap into advanced GIS functionality. With the flood of simple “points on a map” apps out there today, some may question whether any advanced GIS operations or analysis can be performed on the web. REST SOEs demonstrate that all the power of ArcObjects is accessible to your web apps.
Each web API has its own way of calling SOEs, but the common aspect of each technique is that they are making web service requests. The way to call an SOE from the ArcGIS API for JavaScript, for example, is to set up a JSON object with all the input parameters. Once you’ve got the parameters, use the esri.request() method included with the API to make the call to the SOE. You can then write handler functions to work with the response JSON. In my case, the handler function cycles through the returned JSON points and adds them to the map as graphics.
Using the ArcGIS API for JavaScript, I created the simple app mentioned at the beginning of this post. It allows the user to sketch a polyline on the screen and see the resulting distance markers. The app’s intent was to test the speed and usability of my SOE in a web setting.
I was pretty happy with how fast this SOE could place even hundreds of points. To test it yourself, zoom out until you can see the whole county, then sketch a very long freehand line (like a spiral). Usually the points are placed in under a second. (Note that I have placed a limit on this particular service to place only 500 points at a time.) This demonstrates that when ArcObjects code is invoked directly on the server through an SOE, it can run very quickly.

Download the example

There are a number of aspects of SOE development and deployment that I was not able to cover in this post, such as SOE properties and registration, and all the ArcObjects logic used in performing the dynamic segmentation. I have made all the source code of both the SOE and the JavaScript app available on ArcGIS Online so you can explore it yourself. The download comes with a detailed readme file.